
So you're tellin' me there's a chance...
March 25, 2014
A few days ago, we wrote about the unfairness of inviting a data scientist to join an NCAA tournament pool. At the end of the post, we contemplated the high probability that Aaron was going to finish first in the fantasy game. To have one more trash-talking link to send the other league members, we will now use a data-driven approach to simulate the rest of the tournament to find Aaron’s estimated percent chance of winning as of Tuesday afternoon.
The overall strategy
To create projections of how well Aaron’s picks will finish in the tourney, we’ll simulate the remaining part of the NCAA tourney a million times. In the simulation, we’ll use some simple models for (1) which teams are going to win and (2) how many points players are going to score in the games they play. After seeing how things turn out in a million realistic scenarios, we’ll have a pretty good idea of what’s going to happen.
The results
Basically, Aaron dominated even more than we had previously thought. To the player in second place (you know who you are), you have about a 50 out of 1,000,000 chance of winning the pool. Here’s table with the results of the simulation (names have been obscured to protect the losers). Read past it for details about the simulations.
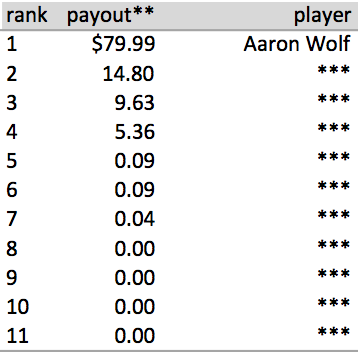
** first place receives $80 / second place receives $30
The details
Simulating games
As a model for simulating the games, we used the team’s seed going into the tournament. We calculated the probability of a lower-seeded team winning with the following formula:
$$p_{win} = \frac{1}{2} * \left( 1 - \frac{\left| seed_a - seed_b \right|}{15} \right)$$
Basically, if two teams have the same seed then it’s a coin flip, but if it’s a sixteen seed playing a one seed then the sixteen seed has no chance of winning. In between, the probabilities scale linearly. This isn’t the best model, but it’s easy and, for the purposes of this blog post, it doesn’t actually matter (more below).
Simulating players
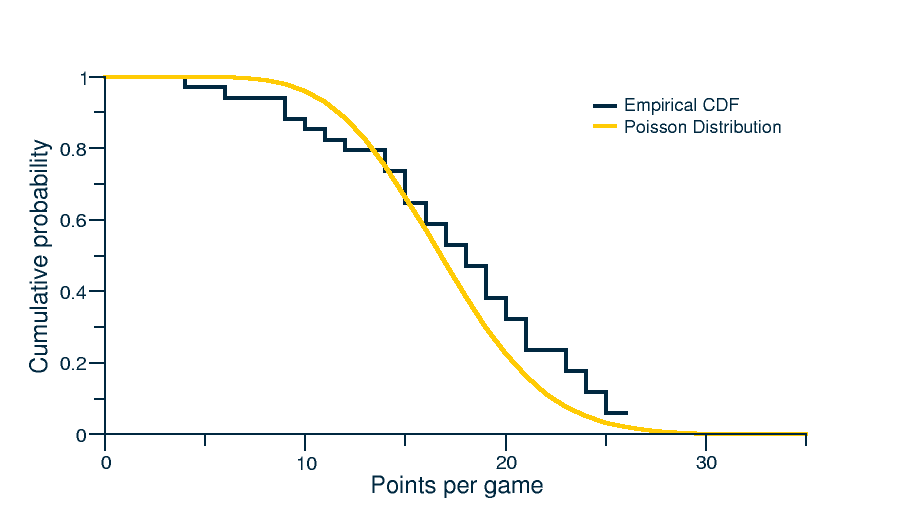
For this pool, we also need a model to simulate the number of points that a player will score in tournament games that have yet to be played. A simple model that does surprisingly well is to treat basketball as a game where there is a constant rate of scoring (fellow nerds: Poisson process). What that means is that we can simulate the number of points that a player will score in a game by drawing from a Poisson distribution with a rate parameter that is their average points per game over the regular season.
To see that the model is reasonable, we took a “random” player from the tournament (Nik Stauskas) and compared the best fit poisson distribution: not bad.
Improvements
Of course, these simulations are only as good as the models that we use, and the models that we chose here are pretty stupid. Here are several potential improvements for our models:
- Player injuries have a big effect on both the game and point simulations: we ignore them. Case in point, Kansas and Joel Embiid.
- In the above models, the number of points a player scores is independent of whether the team wins. A more realistic scenario has a team losing when a player scores less points.
- Use a better win probability model for the teams that finish out the tournament (either use something like SRS or use Five Thirty Eight’s projections)
- We welcome your suggestions for improvement, leave a comment with ideas!
That being said, just to test the sensitivity of this analysis to the choice of models, we also simulated a million brackets by flipping coins instead of the simple seed model. It didn’t change Aaron’s probability of winning at all, but it did change the expected payout of the second place contender by about 30%.
Conclusion


Tweet